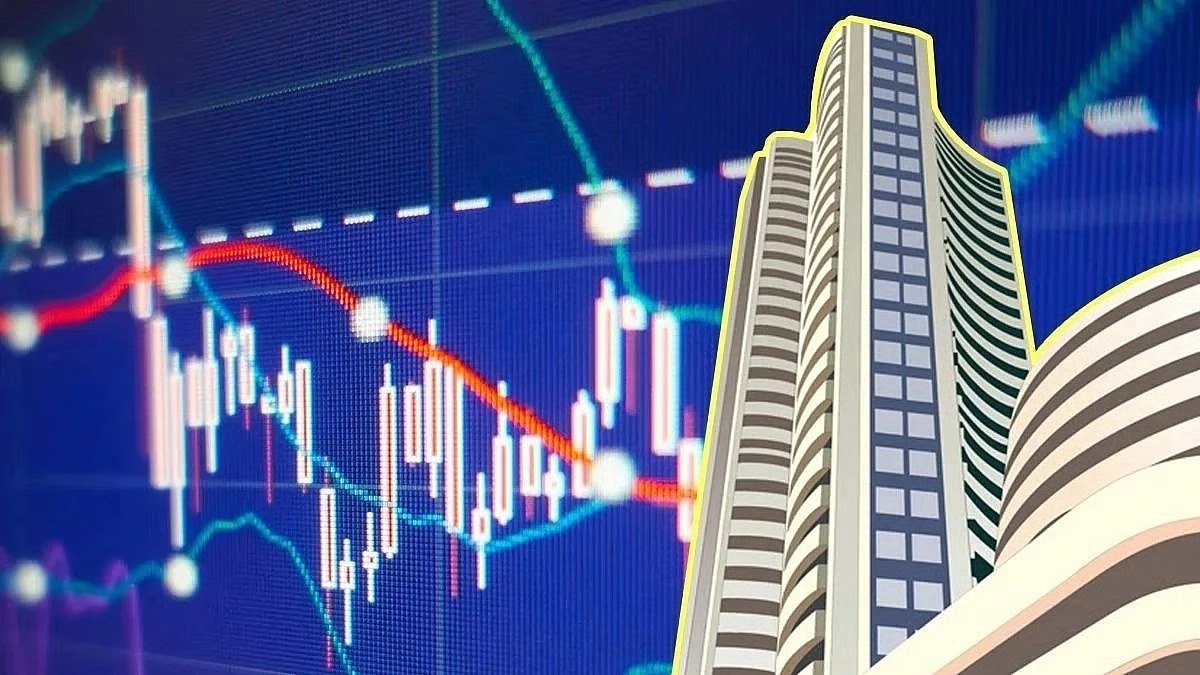

Indian benchmark indices concluded a volatile trading session with mixed movements on August 13, 2026. The BSE Sensex reversed early intraday losses to close 0.15% higher, while the Nifty 50 index pared most of its downward pressure to finish 0.16% lower, reflecting resilient buying interest at lower levels.
Indian equity benchmarks displayed late-session resilience on August 13, 2026, as the BSE Sensex turned positive while the Nifty 50 recovered sharply from intraday lows.
Intraday Market Volatility and Index Trajectory
On August 13, 2026, the domestic stock market experienced a session of two halves, characterized by initial caution followed by a steady recovery. According to official stock exchange data, the benchmark 30-share BSE Sensex opened on a weak note and slipped to an early intraday loss of 0.13%. However, sustained buying interest in select heavyweight counters enabled the index to reverse course, ultimately concluding the session 0.15% higher.
Similarly, the broader 50-share NSE Nifty index opened under pressure, deepening to a loss of 0.34% during early trades amid ongoing global headwinds and elevated crude oil valuations. Organizers stated that aggressive value buying during the afternoon trade helped the Nifty 50 pare its losses significantly, narrowing the closing deficit to finish 0.16% lower.
Macroeconomic Drivers and Sectoral Performance
Market analysts pointed out that domestic equities navigated a complex mix of external cues, including fluctuating energy prices and regional market trends across Asia. According to official exchange filings, institutional trading activity remained a focal point as market participants assessed corporate earnings and macroeconomic indicators. Sectoral indices mirrored the broader market's recovery, with select consumer goods, automobile, and IT counters witnessing buying support that cushioned broader index declines.
Industry experts noted that despite persistent geopolitical uncertainties affecting global energy corridors, domestic liquidity and retail participation continue to provide structural support during market dips. Technical strategists observed that holding crucial moving-average support zones prevented deeper corrections during the session.
Impact on Investors, Retail Participants, and Market Stakeholders
The recovery patterns displayed by the BSE Sensex and Nifty 50 carry practical implications for institutional investors, retail traders, and portfolio managers. For investors, the ability of indices to rebound from intraday troughs underscores underlying market depth and active price discovery.
For retail participants, selective rotation into defensive and high-quality blue-chip stocks highlights the importance of disciplined asset allocation during volatile trading phases. Furthermore, transparent trade reporting by the stock exchanges ensures that market participants retain accurate visibility into daily pricing dynamics.
Why It Matters
The ability of the BSE Sensex to turn positive and the Nifty 50 to recover from sharp initial losses demonstrates structural resilience in India's capital markets. Tracking these benchmark movements provides vital insight into investor sentiment, institutional capital flows, and macroeconomic stability.
Key Facts at a Glance
Exchange Indices: BSE Sensex and NSE Nifty 50
Date: August 13, 2026
Sensex Performance: Reversed an early 0.13% loss to close 0.15% higher
Nifty 50 Performance: Pared intraday losses of 0.34% to end 0.16% lower
FAQ Section
How did the BSE Sensex perform at the close of trade?
The BSE Sensex reversed its early losses of 0.13% to finish the session 0.15% higher.
What was the closing trajectory of the Nifty 50 index?
The Nifty 50 index pared earlier intraday losses of 0.34% to close the session 0.16% lower.
What drove the market recovery during the session?
Market recovery was supported by selective value buying in heavyweight equities and robust institutional participation at lower price levels.
Where can investors access official daily trading data and index reports?
Official closing figures, historical charts, and exchange reports are publicly accessible via the BSE Limited Portal and the National Stock Exchange of India.
Source: BSE Limited, National Stock Exchange of India, Securities and Exchange Board of India